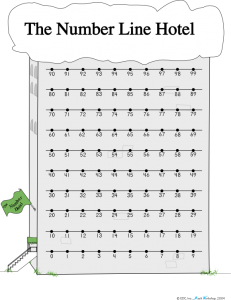
Hundreds Chart and the Number Line Hotel
Hundreds chart

A hundreds chart in which “higher numbers” are higher, and “the 30s” are all on the same row.
Unlike the number line, which is a visualization of numbers used within mathematics as well as in teaching, the hundreds chart — including Think Math!’s Number Line Hotel — is a pedagogical device, a visualization used only for teaching. The use depends on the curriculum.
Opinion: The purpose of such visualizations and other teaching aids is not to be a crutch for “finding the answer,” as they are sometimes used, but to help children build a model of mathematical structure inside their heads. The Number Line Hotel can be very useful for taking a first step toward understanding place value, the structure of our way of naming and writing whole numbers.
Because hundreds charts “chunk” the number line and stack them in strips of 10, it is easy to see the effect of adding 10 to anything. After a bit of practice counting on the chart, children see that adding and subtracting 10 is just a vertical jump, just as adding and subtracting 1 is (mostly) just a horizontal jump.
The hundreds chart shown below begins at 0 and places “higher numbers” higher on the chart.

This anticipates the convention that children will use in graphing (numbers increase to the right and increase as we go up); it gets all the decades on a single row (e.g., the “thirties” are all in one row); and it allows children (and teachers) to use the natural language of “higher numbers” without the conflict between higher value and higher position.
Alternative styles for the hundreds chart
Many hundreds charts start with 1 instead of 0. In most, the numbers increase as one moves down the chart. These are two other commonly seen versions of hundreds charts.
 . . .
. . . 
Why begin at 0 instead of 1?
On many conventional hundreds charts, if you ask a child “show me all the numbers in the thirties,” they appear on two rows! The 30 is at the right hand end of the third row, while 31-39 are on the next row down, which ends with 40. So, one doesn’t see the “thirties” as a single group. Because the Number Line Hotel includes 0 (as a number line must if it is to model measurement), the decades are clearly grouped.
Why put lower numbers at the bottom rather than the top?
On a conventional hundreds chart, the number 53 is “lower” (on the chart) than 43. For some children, this ambiguity between the use of higher-lower as spatial information and higher-lower as quantitative information leads them to wrong answers even though they have the right ideas (they understand the concept, but don’t know which question was asked). It is possible to avoid this ambiguity by choosing different words (e.g., using greater/less for quantitative information), but natural language isn’t easily restricted. It is so natural to ask about higher and lower numbers that the Number Line Hotel stacks the numbers with the lowest numbers at the bottom, more faithfully represent common language. This also follows the conventions used in graphing (numbers increase as we go to the right on the x-axis and as we go up the y-axis).
